Iteration and Visualization
Contents
In this course we will learn how to use techniques from algebra, geometry and analysis to visualize mathematical concepts. The course is built around three themes that each take 1 week to complete. For each of these themes, a number of topics are discussed about which a lesson in mathematical theory is given and a lesson on how to implement this mathematical technique on the computer. Each lesson the students work through a worksheet on each topic in Jupyter and make an image, which they collect in a portfolio. In the penultimate week they choose a topic that belongs to one of the themes and they make a poster about it in groups in the last week.
Topics
- Python Imaging Library
- Affine Transformations
- Tilings of the plane
- Ray tracing
- Moebius Transformations
- Tikz
- IFS-fractals
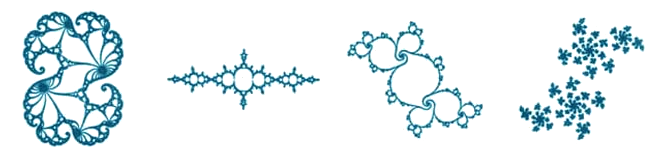
- Julia and Mandelbrot sets
- Random Surfaces
- Fourier transforms
- Fast Fourier transform
- Convolution filters
- Harmonic Functions
Study Material
-
 Notebooks
A zip-file with all jupyter notebooks is available -
honours version
The honours version contains a more in depth treatment of the topics
Learning goals
- recognize transformations of the plane, implement them in python and use them to generate symmetric patterns.
- make a projection of a three-dimensional geometric object from different orientations.
- generate an IFS fractal and determine its Hausdorff dimension.
- Julia, Mandelbrot and Newton-Raphson generate fractals and illustrate the relationships between them.
- describe and approximate a curve and surfaces in polar and spherical coordinates using Fourier transforms.
- implement and use the FFT algorithm to manipulate images
- Apply graphical techniques in python and use new libraries.
- Create a poster that explains a mathematical idea clearly and visually.